
Are you a HubSpot Professional or Enterprise customer who tracks or hosts (Enterprise only) multiple domains or brands in the same portal? Then this is for you!
This post explains in detail how you can use the HubSpot Reporting Add-on to create sources reports (inclusive all the drill down reports) for specific domains, brands, products, subdomains and even subdirectories. Please note that this is a (very good) workaround, however as with all workarounds there are some limitations.
One portal to rule them all?
It is one of the most interesting and intriguing questions when dealing with HubSpot in a multi-brand and/or multi-URL environment: Should you track all your brands and/or domains in the same instance of HubSpot or should you use separate portals for each?
As with everything there is not just one right answer. Generally speaking, the approach with separate licences has some significant benefits from an SEO research and tracking perspective. It also allows to completely separate databfases and user rights, thus minimising human error. It is typically the option I start with when talking to a prospect.
Sometimes other aspects are more important though: most notably the possibility to easily support and track cross-selling and to allow the marketing team to share all their resources across the brands. In that case one global Enterprise portal would be the better option. One Enterprise portal can also be more beneficial from a pricing perspective.
What about the reporting?
One of the things to be aware of when using the approach with one portal is that the main Dashboard and the Sources report (probably the most popular report in HubSpot) are global reports: all data from all brands and/or URLs that are tracked out of the same HubSpot portal are aggregated. This has Pros and Cons:
- On one hand, this is very helpful as it allows us to get the big picture (as you would expect from a dashboard)
- On the other hand, it doesn't allow us to see how we're doing at an individual brand or domain level across the whole platform. Luckily, the HubSpot Reporting Add-on comes to the rescue :-). Let's take a closer look:
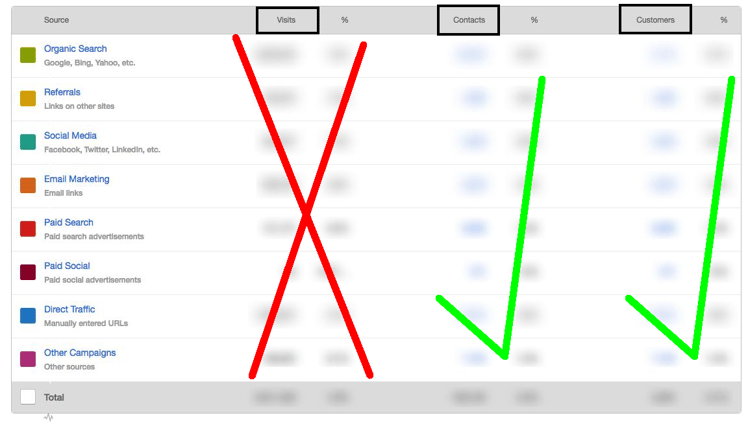
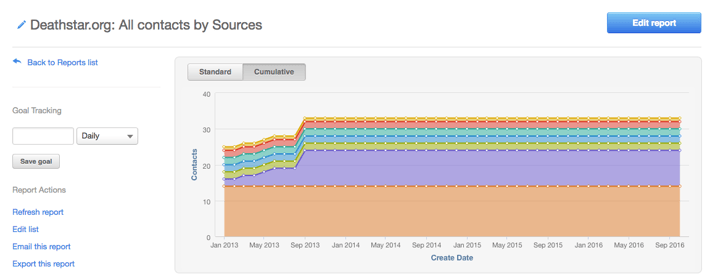
Here we have an example of the standard sources report with the three columns "Visitors", "Contacts" and "Customers" and all the conversion rates.
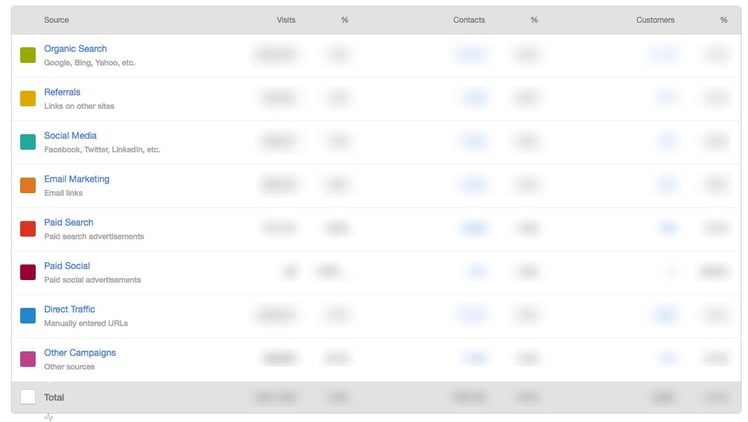
The work around with the Reporting Add-on that I'm going to describe in this post will allow us to re-create every piece of the report for a specific domain for the known contacts (= all data in the "Contacts" and the "Customers" column). The only part we cannot reproduce (at the time of writing), is the anonymous traffic.
To summarise this in one image:
If it is very important to you to also break down the anonymous traffic by brand/domain (and you still chose one Enterprise portal over multiple separate instances), then I would recommend to use another tool for this part. An obvious and excellent free choice would be Google Analytics. Learn more here how to add the Google Analytics tracking code to your HubSpot pages.
A default property and a clever list condition
Before we can start creating reports and dashboards, we need to create lists as the base of the reports. All our lists will be based on the following structure:
- We'll use the default property "First Page Seen"
- and segment the list with the "contains" option.
Here is an example: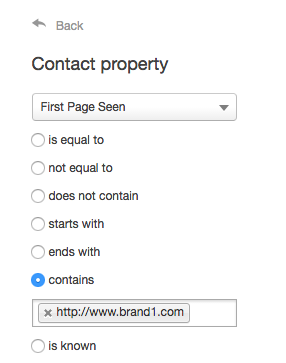
Once we click "Done", it will look like this: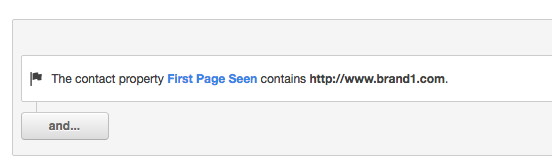
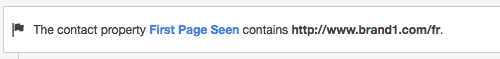
Because the "First Page Seen" property is a text field, we can use the "contains" option to filter by any part of the URL. This simple trick turns out to be very powerful and we can use it for lots of different use cases:
- To track all subdomains of a specific domain:

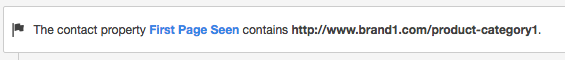
- To track a specific product category
- To track all pages in a specific language
Building lists and reports with Governor Tarkin!
For the purpose of this tutorial (and to stay with the silly Star Wars theme of my posts) let's presume that the evil galactic empire itself has joined the HubSpot customer base. Emperor Palpatine and Co. are using the following setup in the HubSpot domain manager:
- Primary Domain: www.empire.gov (Website, Landing Pages, Blog, Email)
- Secondary Domain: www.deathstar.org
- Secondary Domain: www.alderaan.com
Empire.gov is the primary domain and also the target domain in the portal. Alderaan.com is not in use anymore, it simply redirects all its traffic to www.empire.gov. Grand Moff Tarkin however doesn't want to publish his content on empire.gov. He prefers to publish directly to the secondary domain deathstar.org (requires Hubspot Enterprise) and he also wants to get separate reports.

In order to get those separate reports, we need to first create specific lists as the base of the reports. All lists in this tutorial will use variations of the criteria outlined above.
1. Custom sources report for a secondary domain
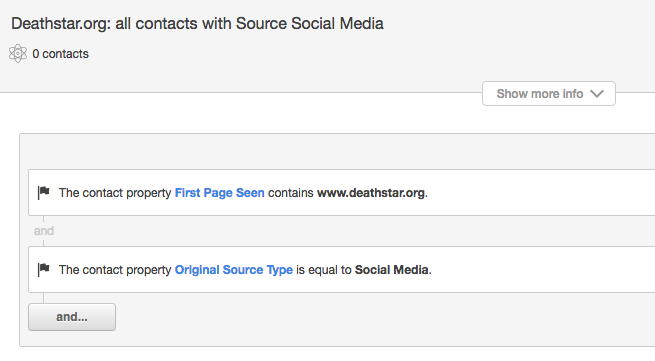
- For the sources report of all deathstar.org leads, we'll create a simple masterlist with the following condition:
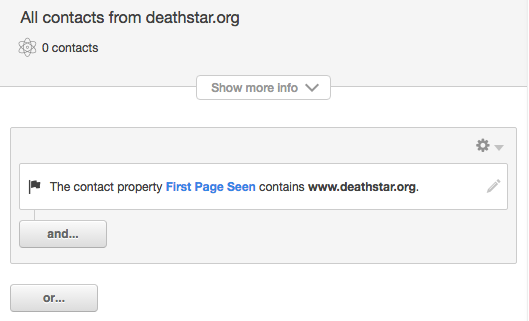
- Now it's time to go to the Reporting Dashboard. We'll start by building a new dashboard. Make sure to use a meaningful name (eg. "<Name of Domain> Dashboard"). I'll call mine "Deathstar.org Dashboard"
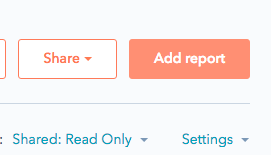
- Create a new report by clicking on "Add report" in the top right.
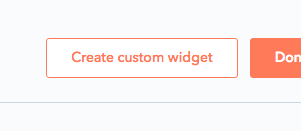
- We're going to build a new report from scratch. Click on "Create custom widget" in the top right.
- On the left hand side select the previously created list ("All contacts from <secondary domain>") to make sure that this report only takes the leads from the specified domain into consideration. Then within the "Measures" section replace the "Lifecycle Stage" option with the "Original Source Type".
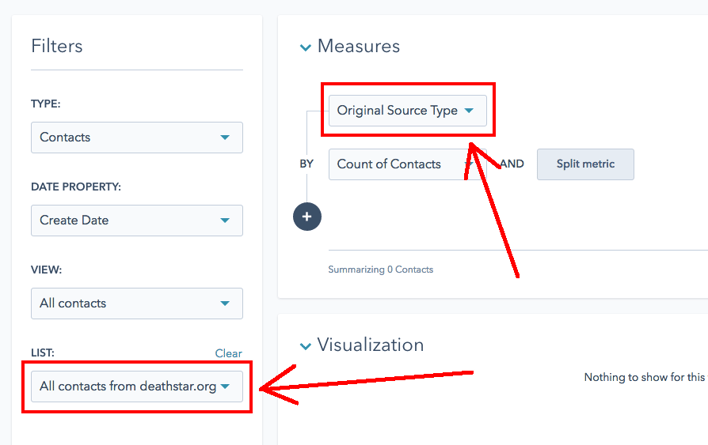
- Et voilà! Your first custom sources report is ready. Give it a name and add it to the dashboard.
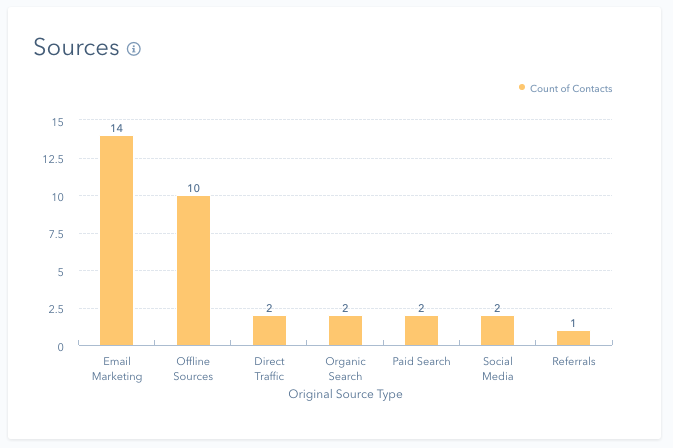
This custom sources report is great but it has two flaws:
- There are no conversion rates or no. of customers
- There is no possibility to drill down deeper as we can with the normal sources report
The great news is that both of those missing elements can be implemented with separate reports.
2. Custom sources report for customers from a secondary domain
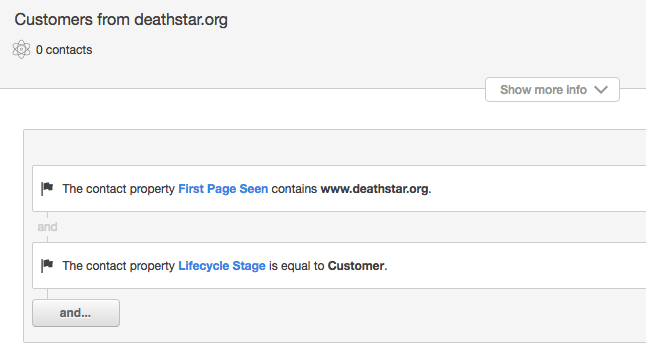
- Clone the list used in the previous report
- Add the following 2nd criteria: AND contact property > Lifecycle Stage > is equal to > Customer.
- Clone the previous report by clicking on "Actions" in the top right corner of the report. Select "Clone"
- Give it a new name (eg. "Sources of Customers") and save it.
- Click on "Actions" again and select "Edit"
- Leave all the criteria of the report unchanged but select the newly created list (all customers from deathstar.org) as the base of the report.

- Done!
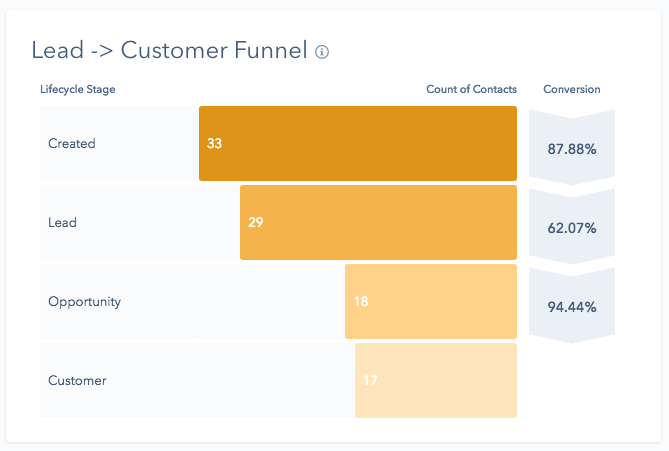
3. Custom funnel report for leads and customers
This report is very easy to build but incredibly powerful. It will even give us some insights that the standard sources report doesn't provide!
- Create a new report
- Select "Contacts" from the widget menu on the left hand side
- Select the "Contact Lifecycle Funnel" widget and click on "Customise"

- Customise the report criteria on the left to use the same list as report 4.1 (Eg. "All contacts from deathstar.org")
- Select all the lifecycle stages you want to see in the report (eg. also MQLs) and update the changes.
4. Custom drill-down report for a specific channel (eg. Social)
Governor Tarkin uses a lot of social media marketing to drive traffic to the deathstar.org website. Post-Alderaan he particularly struggled with lead generation for a while. He is eager to see which social media channels are most effective at creating leads.
- Clone the master list ("all contacts from deathstar.org") again
- Add the following 2nd criteria: AND contact property > Original Source Type > is equal to > Social Media.
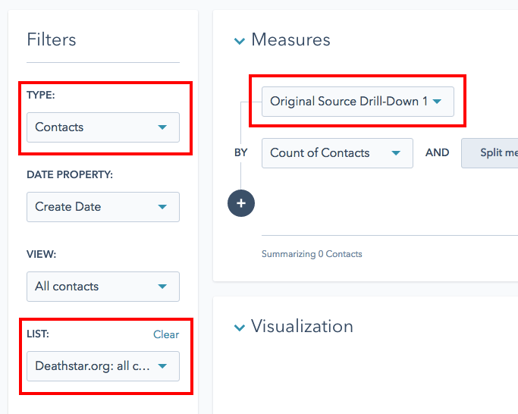
- Create a new report from scratch ("Create custom widget")
- Select "Contacts" from the widget menu on the left hand side
- Select the list of all social media leads from deathstar.org
- Replace the "Lifecycle Stage" within the Measures section with "Original Source Drill-Down 1". (This is the property which contains the social channels)
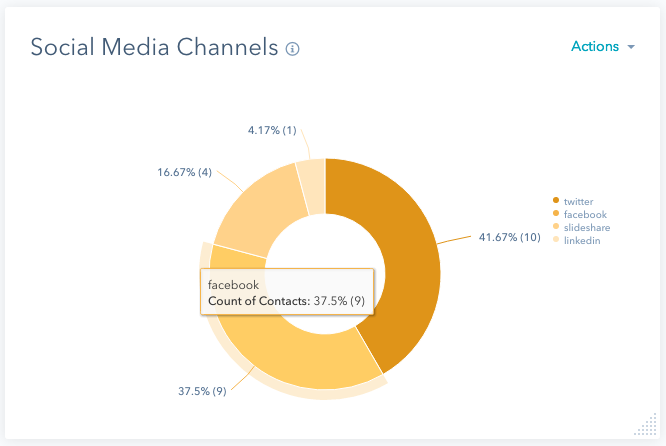
- Select a visualisation option. In this case, I'm going to use the Donut option.
- Give the report a meaningful name, then add it to the dashboard
Please note that you can use the same approach for all the other marketing channels too.
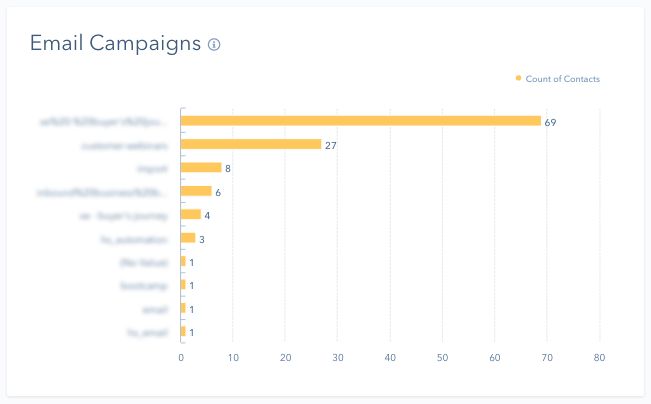
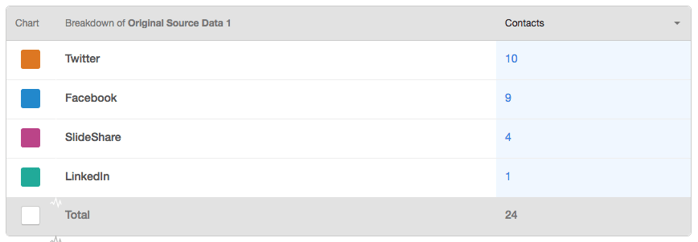
Eg. to create the same type of drill-down report for Emails, you would simply change the 2nd list criteria as follows and everything else would work exactly the same way.
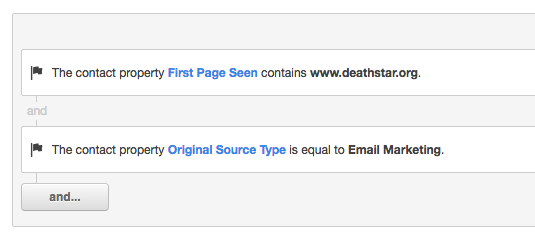
The report could then look like this:
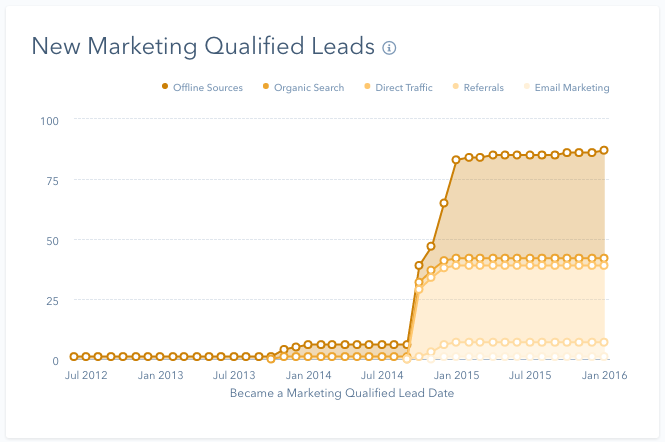
5. Custom report of new MQLs from one domain
- Create a new report
- Click on the "Contacts" widget option on the left hand side and select the "New Marketing Qualified Leads" widget
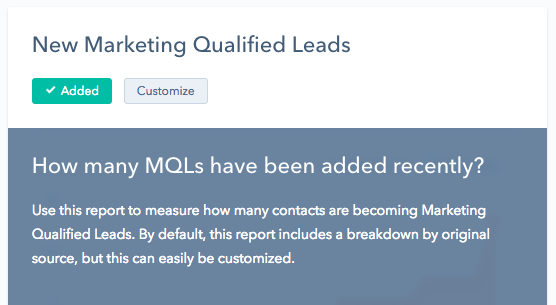
- Click on "Customize"
- Customise the report criteria on the left to use the same list as report 4.1 (Eg. "All contacts from deathstar.org")
- Name and publish the report.
What if I don't have the Reporting Add-on?
- Using Contacts/Companies Reports (Enterprise only)
If you don't have the Reporting Add-on, then you should buy it! :-) No, seriously, you should. It comes at an additional cost but it will add a lot of value to you. However, to be totally transparent, there are some reports you can build without it. Instead of the Reporting Add-on, we can use Contacts Reports and Companies Reports to create some of the same reports.
I'll walk you through two examples: a top level sources report and an example of a drill-down sources report for one marketing channel (in this case social media).
1. Custom Sources Report for a secondary domain
This report is identical to report No. 1 described above.
- Go to "Reports" in the main navigation > Reports Home
- Click on "Create a new Report" in the top right
- Select "Contacts Report"
- Make sure "Start from Scratch" is ticked, then click on "Create Report"
- Select the masterlist containing all contacts from the secondary domain (see screenshot underneath)
- Select the Original Source Type as Break down property (see underneath)
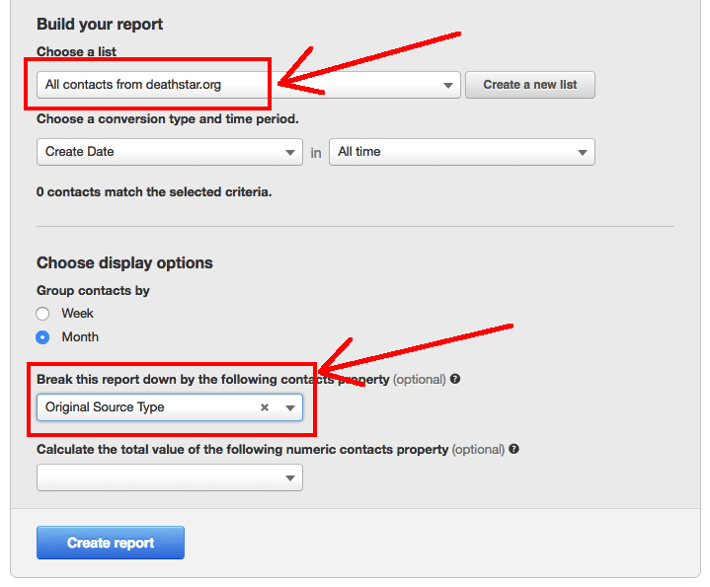
- Click "Create Report"
And here the breakdown by channel: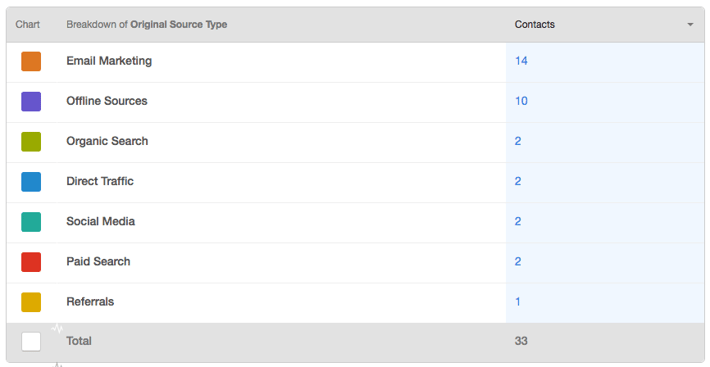
2. Custom drill-down report for a specific channel (eg. Social)
This report is identical to report No. 4 described above.
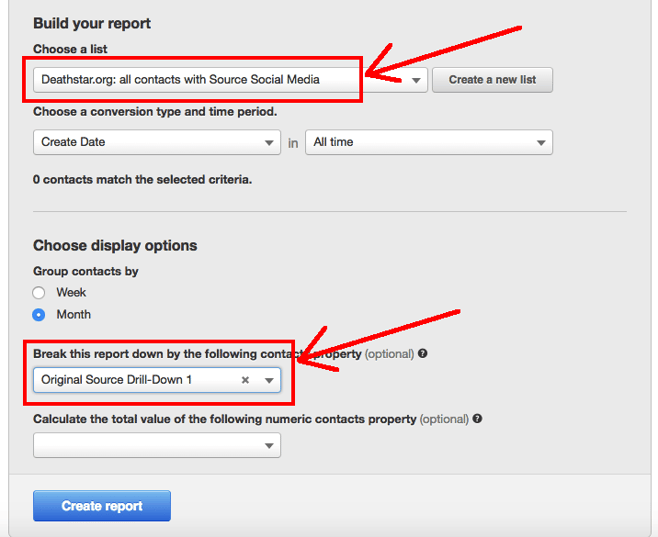
- Clone the master list ("all contacts from deathstar.org") and add the following 2nd criteria: AND contact property > Original Source Type > is equal to > Social Media. (see screenshot above)
- Follow steps 1-4 outlined in the previous report to create a new contact report from scratch
- Use the newly created list (all social media contacts from deathstar.org) and break it down by "Original Source Drill-Down 1"
- Click "Create Report"
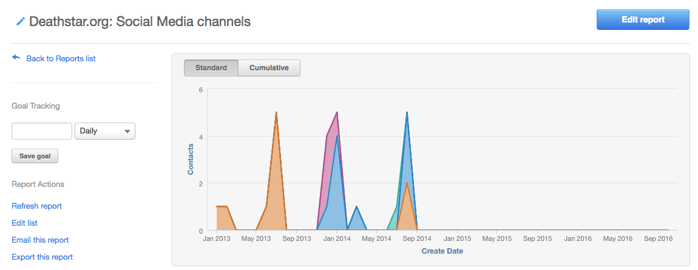
And here the result:
As you can see: in both examples the data is identical to the equivalent reports built with the Reporting Add-on. However there are some downsides of using Contacts/Companies reports instead of the Reporting Add-on:
- There are only a few pre-built reports, most of the reports have to be built from scratch
- All reports exist separately. It isn't possible to group them into dashboards
- You can't compare reports side by side (without jumping between separate browser tabs)
- No deal reports are available (however revenue reporting is possible)
- It is possible to create reports which show the distribution of contacts across the different lifecycle stages, however actual funnel reports with conversion rates are not available
No Reporting Add-on and no Enterprise Reports - what now?
You should CERTAINLY get the Reporting Add-on!!! If you're tracking multiple URLs in a single Professional portal (hosting/creating content in a Professional Account is restricted to one domain) or you would like to get a sources breakdown of your single domain by subdirectory, then your options are limited without the Reporting Add-on. Drill-down reports, funnel reports and revenue reporting aren't possible without exporting lists into Excel.
However, you can get a breakdown by top level source (direct traffic, organic, social, email marketing etc) for any segment of your database (eg. all leads from deathstar.org). The good news is that you don't even need to create a report for this. The system provides it for you.
Using list analytics (Professional and Enterprise)
Every list that you create in HubSpot (PRO and Enterprise) gives you some very useful reporting out of the box: it's called list performance. This article from the HubSpot Academy explains this built-in feature in great detail.
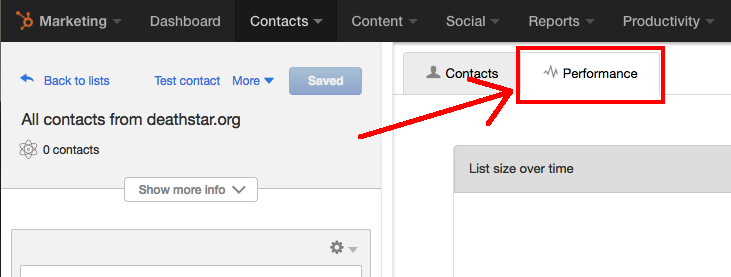
All you need to do is build the lists as described above and HubSpot gives you a free sources report with it. To see the list performance, simply open a list and click on the "Performance" tab at the top":
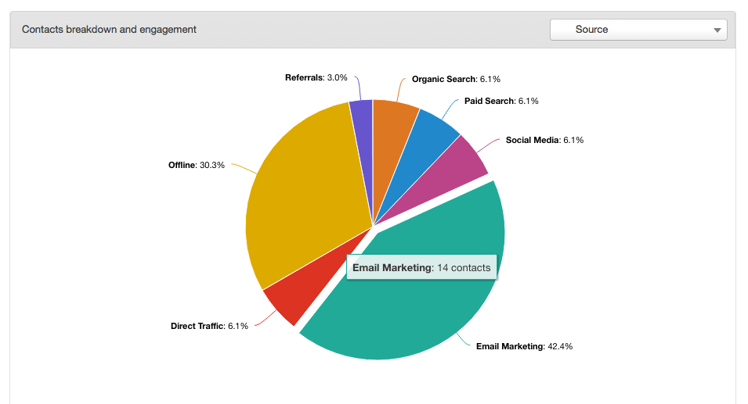
Here are two examples:
Example 1: all contacts from deathstar.org:
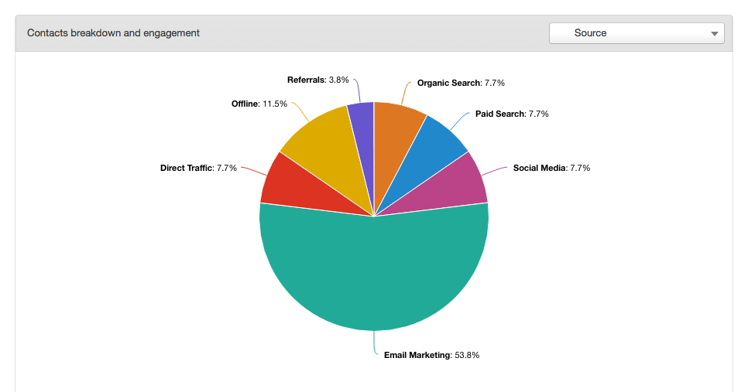
Example 2: all customers from deathstar.org:
Please note: list performance cannot be customised apart from the options described in the mentioned knolewdge base article. It also doesn't allow to drill into the data further. Only the top level sources data is visible.
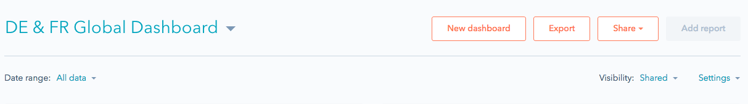
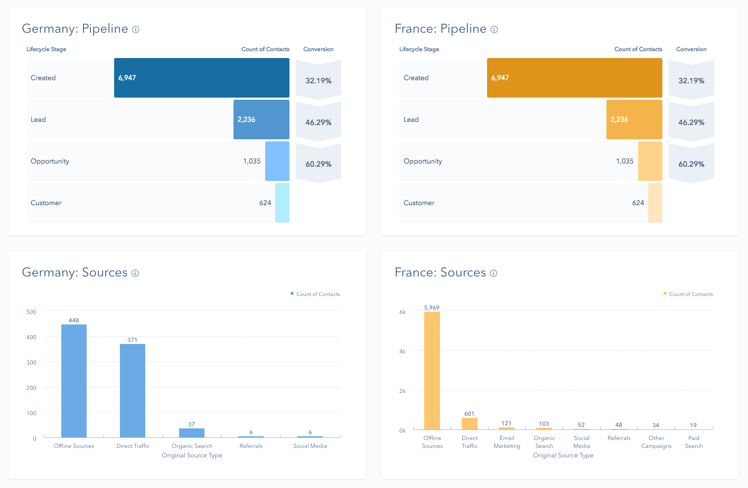
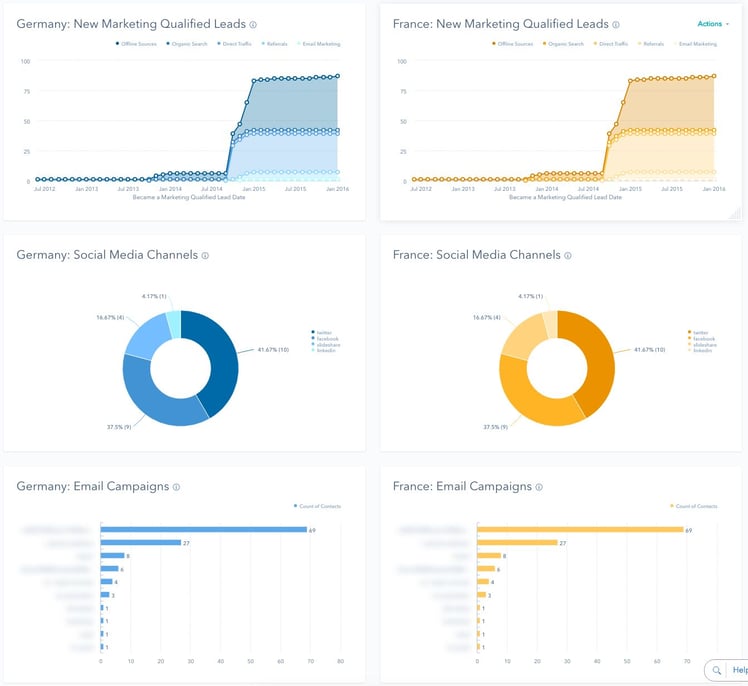
Final tip: Create a global dashboard to compare key reports side by side!
Going back to the Reporting Add-on: I always recommend to create separate dashboards for each domain/product etc. However, in addition to that, it can also be very beneficial to create a Global Dashboard. This will allow you to easily compare all the most important reports and to see the same type of data for each domain directly side by side. Here are some screenshots from a fictious example (with fake data) of a website in two languages. Whether the URL structure involves domains, subdomains or subdirectories - the reports and dashboards would work exactly the same.